Category Archives: Uncategorized

19 June 2011: Alta Vista, KS supercell

We left Norman early in the morning, thinking we might have to make it all the way to E CO to see a supercell. By the time we reached Salina, KS around noon, however, we were waffling between the E CO target, where the shear was better and the cap was weaker, and a more conditional secondary target in NE KS that would probably remain capped until later in the day, but had better moisture. Knowing that the target for the next day might be as far east as Iowa, we decided to opt for the eastern target. We met up with Jeff S., Jana H., and Nick B. in Belleville, KS, where we watched TCU bubble for a couple of hours before some began to take root around 6 p.m. A supercell took shape far to our southeast, then split. We drove to a corn field just east of Manhattan, Kansas, where the left split died over our heads.

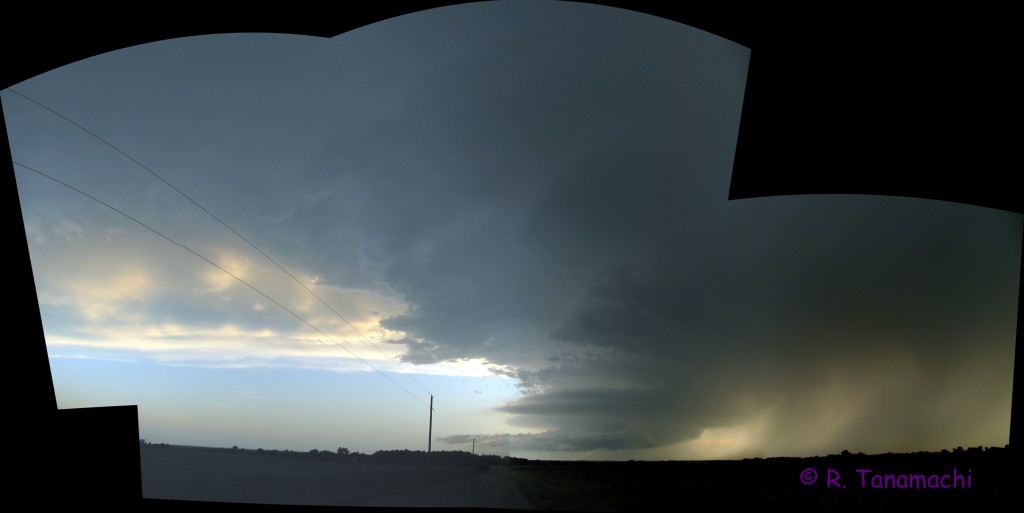
A new supercell near Latimer, KS attracted our attention. At this point we made a strategic mistake – thinking that storm would turn right as it intensified, we headed east on KS-18, south on KS-99, then back west on KS-4, trying to skirt around the core to the east. The supercell, however, didn’t turn right. We could have just as easily headed back into Manhattan and south on KS-177, and intercepted it in about the same place. We ended up adding about half an hour of drive time, and while in transit, we heard reports of a tornado near Latimer. We finally stopped near Alta Vista, KS, and may have seen a dissipating funnel in the diminishing daylight. This view would have to be our reward:

2011-06-19 Alta Vista, KS supercell
Panorama of a weakening supercell near Alta Vista, KS.

A few more wall clouds developed and dissipated underneath the storm, but the show was over. After taking a few more structure and lightning shots, we called it a night.

14 June 2011: Norman, OK high wind and hail event

This video pretty much summarizes the story.

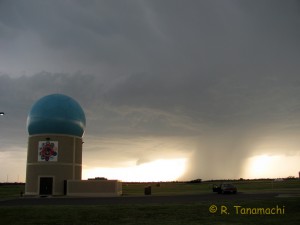
Phased array with rain shaft. Looks innocuous enough.
Dan and I noticed a high-based updraft producing a slender precipitation shaft as we left the NWC yesterday around 6:30 p.m. We decided, on the spur of the moment, to grab our camera gear from the house and head over to North Base to shoot some time lapse near the radar forest.

RaXPol deployed at North Base in anticipation of the coming storm.
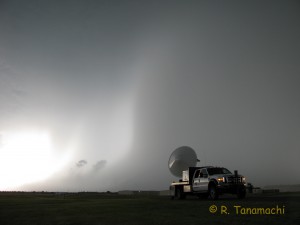
RaXPol deployed just as the rainfoot surged out toward us.
As we were taking video and photos, RaXPol pulled up nearby, so we went over to them. As they began to collect volume scans, the precipitation shaft swelled out a the base and rushed out toward us. We witnessed rotor clouds and ascending rain curtains just ahead of it, before becoming engulfed.

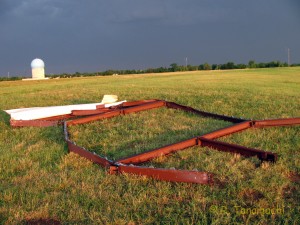
Hangar door debris at North Base
This hangar door blew over 200' from its track to rest in this field. Most of the corrugated metal covering blew away.
For about seven minutes, we experienced bursts of heavy rain, quarter-to-golf ball-sized hail, car-rocking winds, and near-zero visibility. We also saw pieces of metal debris fly across the field from the direction of Max Westheimer Airport. (Later, we figured out that they were from a hangar door that blew off.) We had to shout to be heard over the din of the hail battering the outside of my car. Jackrabbits and a skunk went dashing downwind past us. Nearby ditches and culverts quickly filled with water, and leaves and branches tumbled across the fields.

Social media updates told us of fences blown down, power outages, chimneys partially collapsed, roof shingles peeled away, and lawn furniture either vanishing or appearing where it shouldn’t be. We noted that the damage sounded much worse on the east side, and, having looked at some photos and video from friends of mine who live over there, I believe it!

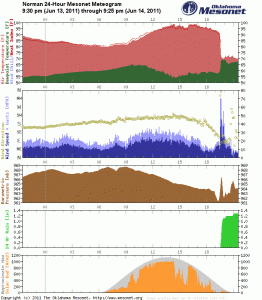
Norman meteogram from 6/14/11
Norman meteogram from 6/14/11. Note the wind spike and other changes at 7:30 p.m. CDT.
The Norman Mesonet meteogram tells most of the story; we were parked just across the field from the station. This event was not entirely a surprise – We were in an SPC slight risk area for convective weather, primarily owing to the threat of strong winds and hail. I may have jumped the gun by labeling this a “microburst” when I uploaded my video; evidently NWS is avoiding that terminology until they do a damage survey. The velocity presentation from the Will Rogers TDWR, however, showed a semi-circular gust front surging toward Norman from the storm in question.

Update: NWS is now characterizing this event as a downburst. You can read their write-up here. They even link to a couple of my photos and video!
Update: My video was also used in an episode of SUNUP TV, an OK State production with a segment provided by the Oklahoma Mesonet, that airs on our local PBS affiliate OETA. Funny thing is, when they requested permission to use the video, I sent them raw clips without the watermark, but what ended up on the air was taken straight off YouTube and still has the watermark. Oh, well!
This video also made YouTube Trends as one of the most viewed in Oklahoma. The two clips on that site are from other people (the first is Mike Coniglio’s, the second from Tornado Titans), but there’s also a link to mine in the end text.

Is it time to modify the (Enhanced) Fujita scale paradigm?

I received many thoughtful and passionate responses to my previous post regarding the upgrade of the El Reno / Piedmont /Guthrie tornado in Oklahoma to EF-5 based, in part on radar observations of 60 m AGL wind speeds. As I noted there/then, the EF scale, as was the F-scale before it is a damage scale, not a wind speed scale. Some have argued that, for this reason, actual wind speed measurements should have no bearing on the EF-scale rating, while others have argued that we should try to incorportate wind speed measurements in EF-scale ratings whenever they are available.

Let’s climb into our “way back machine” and go back to 1971. (Granted, this precedes my own birth by nearly a decade, but I digress.) Dr. Ted Fujita was motivated by the question, “How fast are tornado winds?” Doppler weather radar was still in its infancy, photogrammetry was only possible with high-quality, well-documented film, and in situ measurements of the winds were, logistically, all but impossible to collect (despite valiant attempts to do so). The way I see it, Dr. Fujita asked, “What evidence for wind speeds do tornadoes most consistently leave behind?” His answer: Damage. In 1971, in a paper proposing the Fujita scale, he writes,

“…one may be able to make extremely rough estimates of wind-speed ranges through on-the-spot inspection of storm damage. For instance, the patterns of damage caused by 50 mph and 250-mph winds are so different that even a casual observer can recognize the differences immediately. The logic involved is that the higher the estimate accuracy the longer the time required to make the estimate. Thus a few weeks of time necessary for an estimate with 5-mph accuracy can be reduced drastically to a few seconds if only a 100 mph accuracy is permissible in order to obtain a large number of estimates with considerably less accuracies… high wind-speed ranges result in characteristic damage patterns which can be distinguished by trained individuals with the help of damage specifications…”

Fujita clearly spells out his rationale for the scale; his strategy was to use damage as a proxy for wind speeds in the absence of near-surface wind speed measurements. Forty years later, thanks to innovations like miniaturized, in situ probes and mobile Doppler radar, obtaining near-surface wind speeds in tornadoes is not so far-fetched. Because only a handful of such instruments exist, and deployments are challenging (the presence of a mere tree or building between the radar and tornado can compromise the measurements), we are still not collecting near-surface wind speed measurements in tornadoes with any consistency. And, we are finding that the wind speed bins don’t always match up with the damage indicators in the EF scale.

In my opinion, this means the scale needs to be made more flexible, or possibly supplemented by a wind measurement-based alternative (i.e. two ratings, one damage based and one measurement-based). One could envision expanding the EF-scale into a second dimension (i.e. an EF matrix), the second dimension only expanded if reliable wind measurements (M) are available, and collapsed if they are not. The El Reno / Piedmont / Guthrie tornado would, for example, be rated EF-4 based on its damage, but M-5 based on the RaXPol wind measurements extrapolated to the surface via an objective method.

What I outline above is merely my own half-baked idea, and I am eager to hear other suggestions from people closer to the subject area. I am not a tornado damage expert; I am an observationalist. Keeping the damage-based scale certainly has its merit, primarily in the interest of maintaining consistency with the last 40 years of records (fraught with uncertainty though it may be; see Doswell and Burgess 1988). However, a blanket disregard for reliable remote or in situ wind measurements seems unwise, when obtaining tornado wind speeds was precisely Dr. Fujita’s objective.

.

24 May 2011: Central OK outbreak in brief

To make a long story short: I did not go chasing because I was attending a workshop at the NWC, which let out two hours early. Lacking a chase partner, I stayed, and tried to keep the workshop organizers (many of whom were from NSF in Washington, DC) informed and helped funnel the attendees down into the tornado shelter when the warning was issued. (This was actually my first time being in the NWC during a tornado warning because, usually, I’m out chasing!) Judging by photos taken by a few people who snuck up to the NWC obs deck, the rope stage of the Chickasha/Blanchard tornado was visible for a few seconds. I missed it. The same supercell went on to drop another tornado east of Norman, near Pink, but I didn’t see that either.

My husband was out navigating the NOXP radar, and his crew collected data on the Canton / Fairview tornado. Jeff Snyder reported that he collected an amazing RaXPol data set on the Hinton / El Reno / Piedmont tornado. I have to admit to being more than a bit jealous!

I’m sure either of Dan or Jeff would trade in those data in a heartbeat to restore the lives of the tornado victims. (Five people are confirmed dead as of this writing.) Still, the data collection was a major victory for severe weather research, and hopefully the work that comes out of it will help to redeem some of the tragedy of today.

Update: Corrected locations where radars collected data.

Tornadoes stress vegetation

NASA Science News posted a fascinating piece about the use of satellite imagery in detecting tornado damage tracks.Tornado damage swath detected in IR satellite imagery.

When I was an undergraduate research assistant at the University of Wisconsin – Madison about a decade ago, I examined similar infrared satellite imagery for indications of drought. As we all learned in biology class, leaves maintain crucial range of moisture levels and temperatures in their interior largely by controlling water flux through their outermost few layers of cells. Tornadoes batter vegetation and shred leaves into tiny pieces, exposing their moist interiors. (I never saw the rain-wrapped 10 May 2010 Tecumseh, OK tornado pass by a few miles to my south, but shredded leaves rained down out of the sky for several minutes after it passed. I only see that kind of vegetation lofting in the immediate aftermath of a tornado.) If the plant isn’t killed outright, it becomes “stressed”, changing its reflectance characteristics at different wavelengths.

Healthy vegetation reflects strongly in the near-infrared wavelengths (around 0.9 microns), but stressed vegetation reflects weakly. In addition, stressed vegetation lights up in a band centered around 1.9 microns, as this diagram from NASA shows:
Wavelength vs. IR reflectance for healthy vs. stressed vegetation
A logical “signature” for stressed vegetation, therefore, might be R(0.9 microns) – R(1.9 microns). When this value is positive, the vegetation can be inferred to be healthy. When it’s negative, indications are that the vegetation is stressed. This is likely not the exact formula used by the ASTER researchers; I just made that up on the spot. A robust index would be based on examination of many different wavelengths, different vegetation types, and over many seasons. (Obviously, this is not my area of expertise any longer!) One might be able to determine an optimal stressed vegetation indicator using a statistical technique like principal component analysis (PCA).

I remember seeing similar satellite images of the 3 May 1999 tornado damage swath through Moore. This paper, from Dr. May Yuan of the OU Department of Geography, contains prime examples. Neat stuff.

New Taipei City, Taiwan tornado

In the meantime, my attention has been drawn to a widely-photographed tornado on May 12th near Taipei, Taiwan.

It is not often that you see a tornado in a densely-populated city (simply because cities cover such a small portion of the Earth’s surface), and can use surrounding buildings to gauge the size of the condensation funnel. The tornado appears to touch down in a park between the viewer and some multi-story apartment buildings that I estimate are about a mile away. The rapidly-rotating cloud base is about twice as high above the ground as the tops of the apartment buildings. One media report says that the visible funnel is only 20 stories, or about 50 m, tall, even though the rotating portion of the storm clearly extends much higher. According to the accounts I have read, no deaths or injuries resulted from this tornado, and the only reported damage was to a van.

Auckland, New Zealand tornado

My attention has been drawn to some rather dramatic footage of a tornado in Auckland, New Zealand. A single fatality resulted.

The tornado easily sweeps aside vehicles – yet more evidence that trying to tangle with a tornado in a car is a bad idea! Surprisingly, some of the drivers appear to be completely oblivious to the tornado until the last second.

The tornado lifts some flimsy roofing material off a shopping center. The strips of material, gracefully lofted hundreds of meters into the air, clearly show that the the tornado is rotating clockwise (cyclonic in the Southern Hemisphere)!

More thoughts about the disaster in Japan

Okay, I know this is supposed to be a blog about my severe storms research. But the Japan earthquake, tsunami, and now nuclear disasters have all hit rather close to home. That’s because Japan was home for me, for the summer of 2005. Japan is the country where I had to re-learn how to go to the bathroom, how to go shopping with the vocabulary of a three-year-old child, and where I joyfully re-established contact with my extended family on my father’s side. I sweltered in the Tokyo summer heat, shouted over deafening cicadas, slurped down bowls of Hakata ramen, and felt the gentle jostle of the trains that took me anywhere I wanted to go. The perpetual chimes and recorded announcements, the exquisite artistry and fashion, the delicate palette of flavors, and the gamut of emotions I experienced in Japan are all packed into a treasured space in my memory. Occasionally, they resurge into my consciousness, stimulated by a taste or a sound. I cherish those memories even more so now that substantial portions of Japan have been changed, many irrevocably.

It’s not like I ever got to visit or travel through any of the areas of northeast Japan that have been wiped away by the tsunami, or that will probably be contaminated for decades by radiation from exposed nuclear waste. (The latter situation is still unfolding as I type this.) It’s not as if I personally knew any of the victims swallowed by the mass of black water and debris that surged horrifically across the perfectly gridded and manicured farmlands of Sendai, crushing house after house in the seaside towns. (My relatives are all on Kyushu, in the southwest, well away from the disaster zone.) I don’t know these places, and yet, somehow, I do. I barely even know the Japanese language, so I have been having to rely on NHK’s own halting English interpretations of their local coverage. I’m not going to pretend to have any particularly apt insight into the Japanese psyche and how it might respond to this compound disaster. What I see is a land I am very fond of, facing its greatest crisis of the modern era. I am sitting comfortably in Norman, Oklahoma, hard pressed to do anything about it. So I think, and write.

Japan erupted (quite literally) out of the ocean when the spine of the Pacific plate butted up against an extension of the North American plate. As a result, the distinctive landscape, with its severe grade and some active volcanoes, is largely uninhabitable, so most people amass around the coasts and in small mountain enclaves. (My own last name, Tanamachi, translates as “shelf village,” in reference to a gently sloping locale on one of these mountainsides where a small contingent managed to get a foothold.) The open fetch of warm ocean to Japan’s south and east provides ample moisture that makes Tokyo a concrete sauna in July and August, but also helps the rice crops growing in the rich volcanic soils to flourish, and fills the surrounding sea with all manner of delectable creatures. The same warm ocean is also fertile ground for the formation of monstrous typhoons. Japan is rocked from beneath by earthquakes and volcanoes, while tsunamis and the ferocious winds and rain of typhoons try to erode Japan back into the ocean from above. It is no wonder that the predominant religion (Shinto) is an animist one – the very earth on which Japan was born is very much alive, and voracious. The other major religion, Buddhism, teaches that life is suffering, and that nothing is permanent.

Time and again throughout history, Japan has seen its cities and people consumed by disasters, and often had to rebuild from scratch. Communities and entire families could be wiped out in a few seconds, historical sites and documents lost forever. Disaster preparedness is ingrained into Japanese culture. Everywhere you go in major cities, signs in many languages point the way to earthquake and tsunami refuge areas. Very small children learn songs and games that teach what to do in an earthquake. The word “tsunami” is itself a Japanese word. On the island of Amami-Oshima in 2005, I watched a city (Naze) hunker down for the passage of a Category 4 typhoon, then resume business as usual the very next day after cleaning up only a few leaves and bits of windblown trash.

The Japanese were certainly not caught unprepared by last Friday’s earthquake. They have learned the lessons of history well, the pain of loss forging links to generations past and future. The billions spent on earthquake-resistant buildings (which I mentioned in my last post) and evacuation procedures doubtless saved thousands of lives. The tsunami was different story. One cubic meter of water weighs 1000 kg, or about 2200 lbs. Knowing this, one can begin to comprehend the destructive power of a 10 m-tall tsunami crashing ashore. Most human-made structures simply buckled under the lateral strain and washed out to sea. The only effective survival strategy was an uphill escape.

The world knows that the Japanese work hard, and play harder. But the earth is continually trying to shrug Japan off, often with devastating consequences for its human inhabitants. In light of this fact, the seeming Japanese national mania for novelty, technology, and connectivity may be a little bit more understandable. What would you do today, if you knew you might not be here tomorrow?