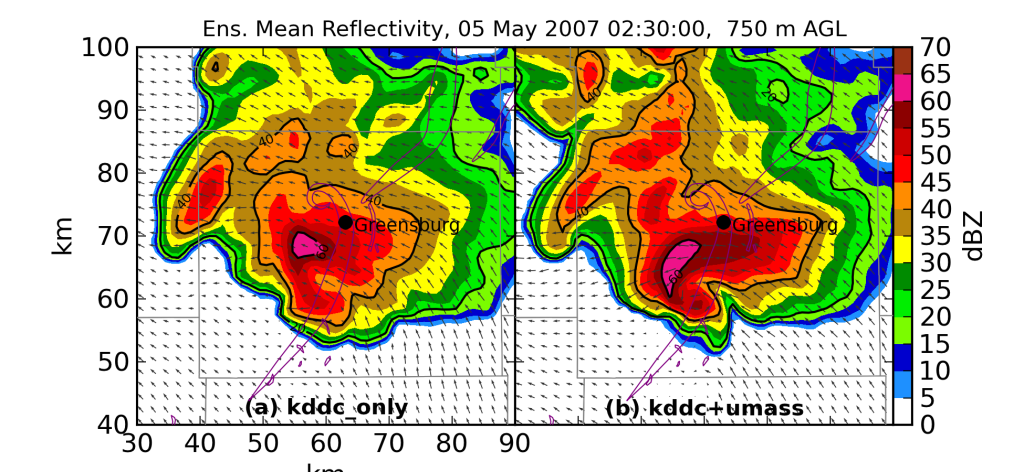
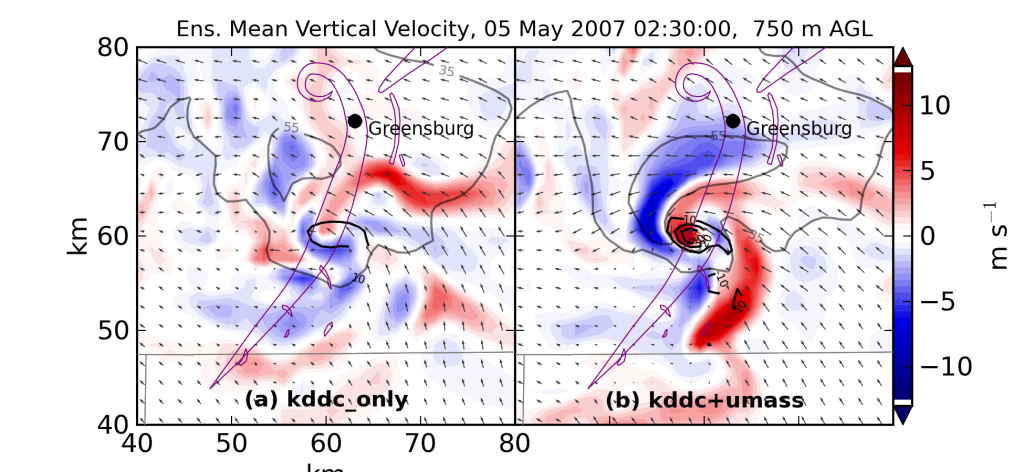
This month’s issue of Monthly Weather Review contains my newest paper, EnKF assimilation of high-resolution, mobile Doppler radar data of the 4 May 2007 Greensburg, Kansas supercell into a numerical cloud model, describing the second half of my dissertation research. (Yes, I know I graduated over a year ago… Publication takes a long time, as well it should!) The take-home message of the paper is that low-level (< 1 km AGL) wind observations make more realistic analyses of supercells (and other rapily-changing atmospheric phenomena). Supercells have a lot going on under the hood – updraft and downdraft pulses, mesocyclone cycling, cold pool generation, etc. – not all of which are apparent to the naked eye or even to an advanced, 4D observing system like a radar. Computers can help fill in some of the gaps via process called data assimilation (DA).
For those not familiar with DA, it means combining atmospheric observations (such as those from a radar) with a computer-generated weather forecast in order to produce a mathematically optimal, 3D analysis of the atmospheric state. You then use the analysis to launch a new forecast. Rinse and repeat every few minutes. The end result is a series of 3D snapshots of the storm, which you can use to diagnose the storm’s inner processes. (There is a gargantuan body of theory required to combine these two very different types of input and assess the quality of the analyses. I shan’t bore you with the two semesters’ worth of details that I slogged through in grad school.)
For this study, I used an advanced DA technique called the ensemble Kalman filter (EnKF) to assimilate NEXRAD (from Dodge City, Kansas) and UMass X-Pol data collected in the Greensburg storm. In one set of experiments, I withheld the UMass X-Pol data (which were collected more frequently and closer to the surface). The mesocyclone of the simulated Greensburg storm was much stronger and more persistent in the experiments where I used the UMass X-Pol data, and the updrafts and downdrafts stronger and more compact. While we lacked independent data to use for verification, making our assessment necessarily qualitative in some regards, our results are consistent with previous DA studies using artificial, “perfect” radar observations.


I described in a previous post our serendipitous UMass X-Pol data collection in the Greensburg, Kansas storm of 2007, and how that evolved into a detailed case study published last year. My husband lead-authored a companion study earlier last year where he assessed whether modifications to the initial model environment changed the forecasts. (Answer: Yes. Quite a bit, in fact.) This pub completes the trifecta. As we were about to submit this paper for peer review, we made a last-minute decision to switch the DA software to a system that was more extensively tested for severe storms. Even though that added a month to the prep time, I am glad that we did, because the resulting analyses, generated from the same observations, looked markedly better.
I wrote this paper during my CAPS postdoc with the able assistance of my co-authors, representing a fruitful collaboration between SoM, NSSL, and CAPS. I manually edited and dealiased all the radar data (a task that took nearly two months). I had the benefit of two astute reviewers (including my brother-in-EnKF, Dr. James Marquis) who asked some mighty tough questions. And I got to share this MWR issue with some other super scientists – Tom Galarneau, Jeff Beck, and Chris Weiss.