I have a new paper in the November issue of Monthly Weather Review entitled, “Near-Surface Vortex Structure in a Tornado and in a Sub-Tornado-Strength Convective-Storm Vortex Observed by a Mobile, W-Band Radar during VORTEX2,” written the help of six patient co-authors and three reviewers. This paper addresses the question, “If it looks like a tornado, lasts as long as a tornado, and behaves like a tornado, but only on radar, is it still a tornado?”
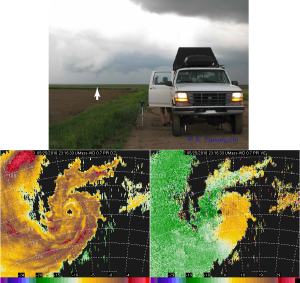
We examined two cases from VORTEX2. In the first (25 May 2010 near Tribune, Kansas), both humans and radars observed a tornado under the hook echo of a supercell. Here is a photo of the Tribune tornado, along with some the W-band data Krzysztof Orzel (UMass) and I collected:
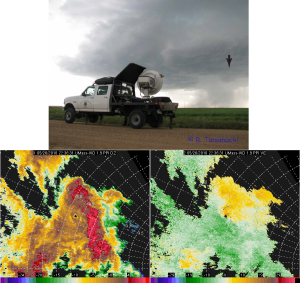
In the second (26 May 2010 near Prospect Valley, Colorado), the radars observed a feature beneath the hook echo of another supercell that looked similar to the tornado seen the previous day, none of the hundreds of storm chasers in the area, including about 100 VORTEX2 participants (some of whom can be counted among the most experienced storm chasers in the world!), reported a tornado or even a funnel cloud. (The Prospect Valley storm produced tornadoes earlier in the afternoon near DIA, but none during VORTEX2 operations.) Indeed, I didn’t even know the vortex was there until the data were post-processed, because it was too small to see on our in-cab display. Closer examination revealed seven of these tiny vortices spinning up in tornado-family-like fashion on the tip of the hook. The one pictured below (#5) was the strongest and longest-lived.
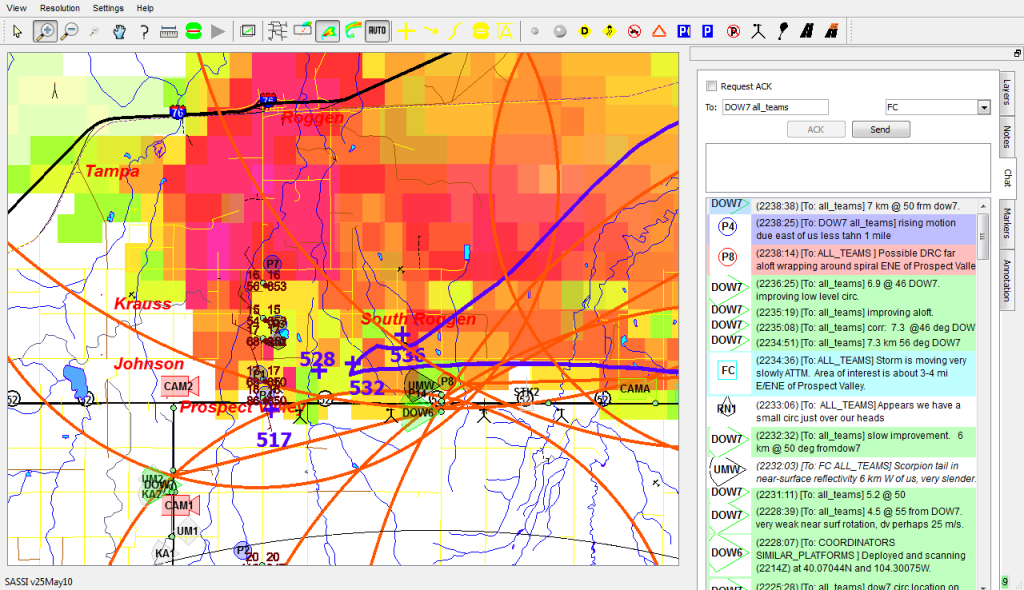
Here’s a screenshot from our in-cab Situation Awareness for Severe Storm Intercept (SASSI) display around the time the above data were collected, showing participants reporting a “small circulation” and “rising motion”. But, no one says the T-word.
The radar presentations look similar, no? Those of us who use mobile radar data need “tornado threshold” criteria in order to determine objectively such parameters as tornado start and end times. While there is no universally accepted Doppler velocity threshold for tornadoes, the Alexander and Wurman (2008) criterion (40 m/s across <= 2 km diameter, and persisting for at least two consecutive scans) is used in a number of studies. Both the 25 May and 26 May vortices met this criterion and lasted about 8 minutes, but had it not been for radar observations, we might not have known a vortex was present on 26 May.* We appear to have caught a vortex that just barely tickled the lower end of the tornado spectrum. The surface dew point depressions were much higher - about 12 oC – than on the previous day (8 oC). We speculate that just a little additional moisture would have made this vortex visible and changed the designation of the 26 May case from non-tornadic to tornadic in the VORTEX2 logs.
One might ask, “Who cares? The Prospect Valley vortex damaged nothing and injured no one.” As a scientist, I care. Documenting these types of events with high-quality observations demonstrates that the boundary between tornadic and non-tornadic vortices is fuzzy, and that human and radar detection of tornado occurrence may not always be consistent. Since this article appeared online last week, I’ve gotten a number of e-mails from other scientists who have made similar observations of weak vortices under supercells, but who weren’t sure how to categorize them. We didn’t want to make a new category of vortex for this type of event – there are already enough animals in the zoo*,** – but in this paper we use the clunky term “sub-tornado-strength, convective-storm vortex (SCV)” to describe the Prospect Valley not-quite-tornado.
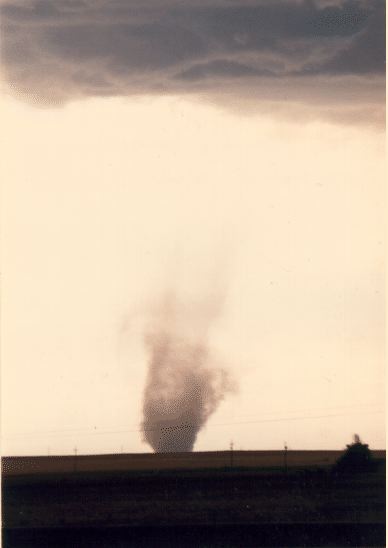
* Dr. Chuck Doswell documents a similar case using a photograph from Dr. Bill Gallus in his essay, “What is a tornado?” Incidentally, that tornado also occurred in Colorado. The Prospect Valley vortex would not meet Chuck’s tornado definition because it caused no damage.
** CSWR documents a number of these in a recent paper in Weather and Forecasting, including what they call “marginal tornadoes.”